


The COVID-19 dashboard for Champaign County now has even more data, and their overall COVID website is now much easier to navigate.
If you haven’t looked at the dashboard in awhile, you might want to check it out. I’ll admit I haven’t. I know things are not good, my plans are not changing, I can’t process all the numbers right now, I’m just staying the course. But I know there are lots of data-hungry folks out there, and those who want to know exactly where we stand as a county.
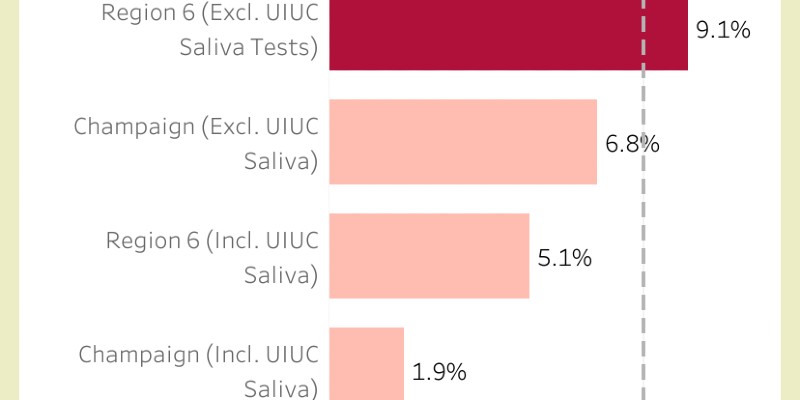
The biggest change this time around is the addition of a nice bar graph that shows where we are as a county and as a region in terms of meeting the criteria to lift the Tier 3 mitigations. You can see our test positivity rates with and without U of I testing.
As always, we are eternally grateful to Julie Pryde and her team for continuing to provide us with updated information, and for the hard work and long hours they put in trying to keep our community safe and healthy.
Screenshot from Champaign-Urbana Public Health District website.