


If you haven’t read Smile Politely’s previous coverage of this issue:
Yesterday I finally received a somewhat-usable response from the Champaign Police Department to my request for the location and demographic information on all battery and aggravated battery cases in Champaign from 2006 to 2010. I compiled it into a spreadsheet, which you can download here in Excel format, or here in PDF format. The 2010 statistics are put together through November 30.
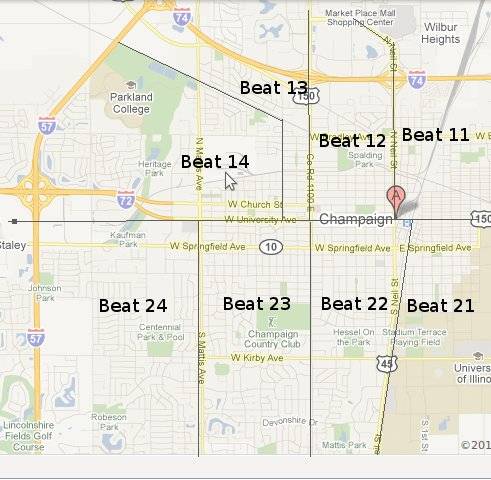
The CPD did not find themselves to be legally obligated to provide specific locations and demographic information for each crime. The number of cases for each year, with the number of “victims” and “offenders” for each demographic category, were broken down into eight different geographic “beats.” The beats are delineated on the map at the top of the article. It’s a bit more confusing than I would like, but such is life.
Even after several iterations of requests, there’s still a discrepancy between the number of battery and aggravated battery cases on these reports and the previous total number of such crimes provided by the CPD. I’ve requested a clarification from them, and will update the information in this article as it becomes available. However, this is the last day we’re publishing new content until January, so I needed to pass along the statistics I was provided in the state that they were provided.
I hope to, in the near future, update this post with some graphs, and maybe even some conclusions, which will make the data easier to digest. In the meantime, however, I just wanted to get the data out there. Please take a look at the spreadsheet in Excel or PDF format, and fire away with any questions in the comments.