


College sports are big business. Coaching salaries, media rights, and ticket sales all point to a booming industry generating hundreds of millions, if not billions, of revenue each year.
Prompted by a Freedom of Information Act (FOIA) request, the University of Illinois, Urbana-Champaign (U of I), has released documents pertaining to revenue and expenses for its athletic department in 2013, the most recent reporting year, broken down in subcategories and by sports.
A quick analysis reveals that football and men’s basketball are not only the two most profitable sports within U of I but also the only two programs that made money altogether, in spite of their considerable expenses.
This report is organized with charts and graphs in the following manner:
- Total revenue by subcategory, regardless of the sports program
- Total expenses by subcategory, regardless of the sports program
- Revenue and expenses of each sports program
- Revenue and expenses by the Big 3: Football, men’s basketball, and women’s basketball
- Revenue and expenses for all other sports
- And revenue and expenses for the category “no program specified”
This information has been arranged what hopefully is the most understandable and easily-to-digest manner possible. If, however, you have any questions, comments, or concerns, feel free to leave your message in the comments box below the report.
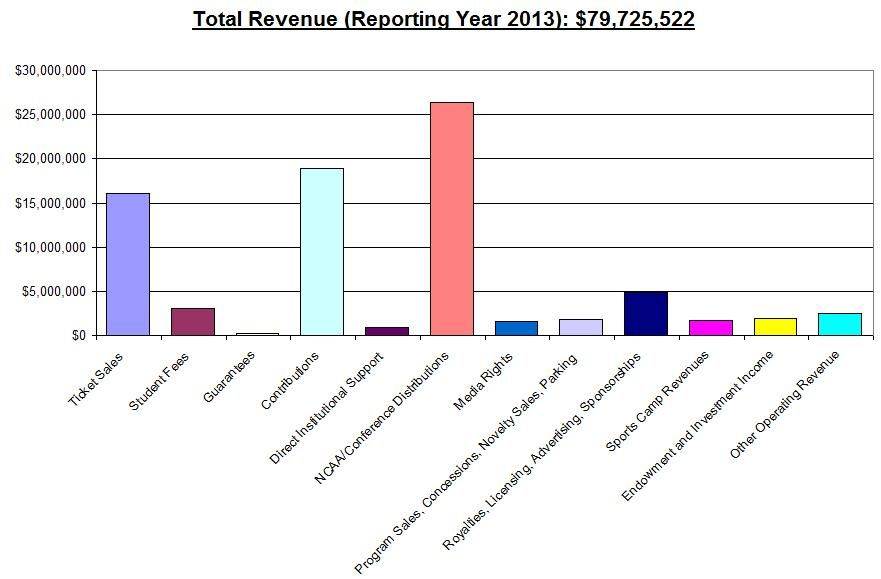
Total revenue for the 2013 reporting year came to $79,725,522 for the U of I athletic department, with the bulk of that revenue coming from NCAA/Conference distributions ($26 million), contributions (nearly $19 million) and ticket sales ($16 million).
The document released by U of I states that:
- NCAA/Conference distributions “include revenue received from participation in bowl games, tournaments, and all NCAA distributions. This category includes amounts received for direct participation or through a sharing arrangement with an athletics conference, including shares of conference television agreements.”
- Contributions “include amounts received directly from individuals, corporations, associations, foundations, clubs or other organizations that are designed, restricted or unrestricted by the donor for the operation of the athletics program.”
- Ticket sales “include revenue received for sales of admissions to athletics events.”
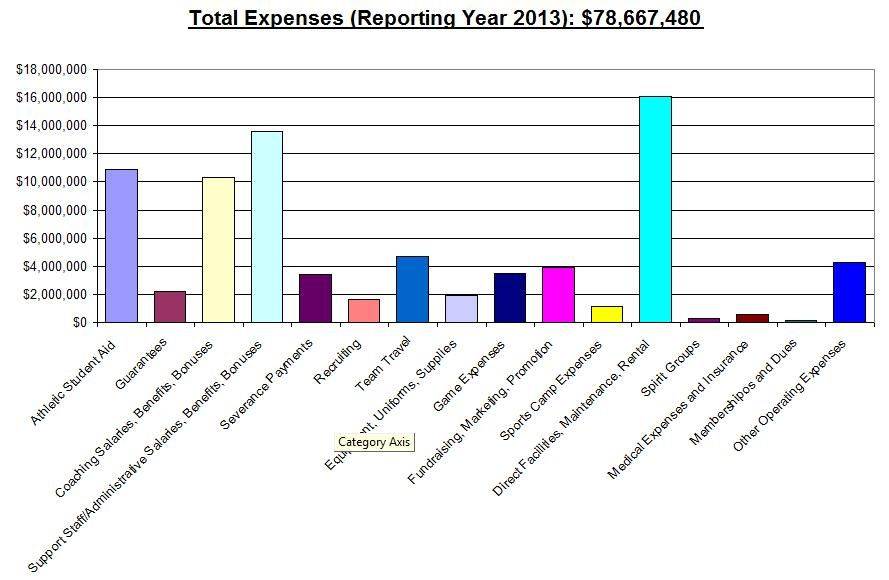
Total expenses for the 2013 reporting year came to $78,667,480 for the U of I athletic department, with four subcategories dominating the expenses: Direct facilities, maintenance, and rental ($16 million); Support staff/administrative salaries, benefits, and bonuses ($13.6 million); Coaching salaries, benefits, and bonuses ($10.3 million); and athletic student aid ($10.8 million).
Definitions for the four subcategories are:
- Direct facilities, maintenance, and rental “include direct facilities costs charged to intercollegiate athletics, including building and grounds maintenance, utilities, rental fees, operating leases, equipment repair and maintenance, and debt service.”
- Support staff/administrative salaries, benefits, and bonuses “include gross salaries, bonuses and benefits paid to administrative staff that would be reportable on university and related entities W-2 and 1099 forms.” This includes car stipends, country club memberships, entertainment allowances, compensation from camps, radio and television income, among others.
- Coaching salaries, benefits, and bonuses “include gross salaries, bonuses and benefits provided to head and assistant coaches.”
- Athletic student aid includes all “athletically related student aid awarded, including summer school and tuition discounts and waivers.”
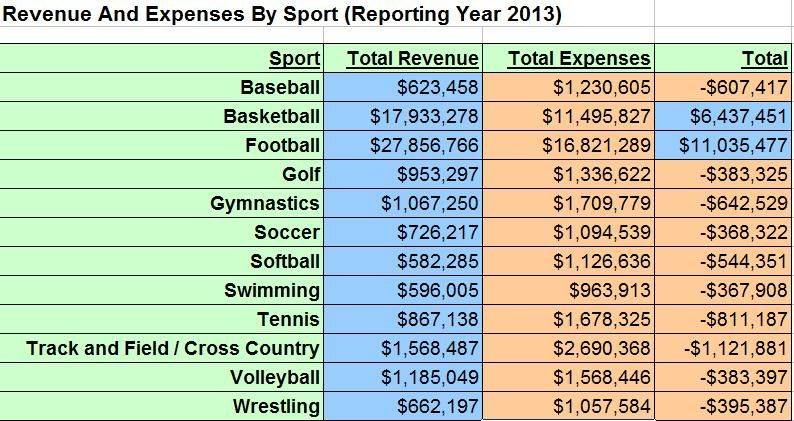
The above image shows revenue and expenses by sport for the reporting year of 2013. Football and basketball bring in the lion’s share of the money, and both are the only two programs that actually cover their expenses (football by $11 million and basketball by $6.4 million).
After football and basketball, the following three sports that bring in the most revenue are track and field/cross country, volleyball, and gymnastics, with each bringing in over $1 million.
After football and basketball, the following three sports with the highest expenses are track and field/cross country, gymnastics, and tennis, with each sport exceeding the amount of revenue they bring in.
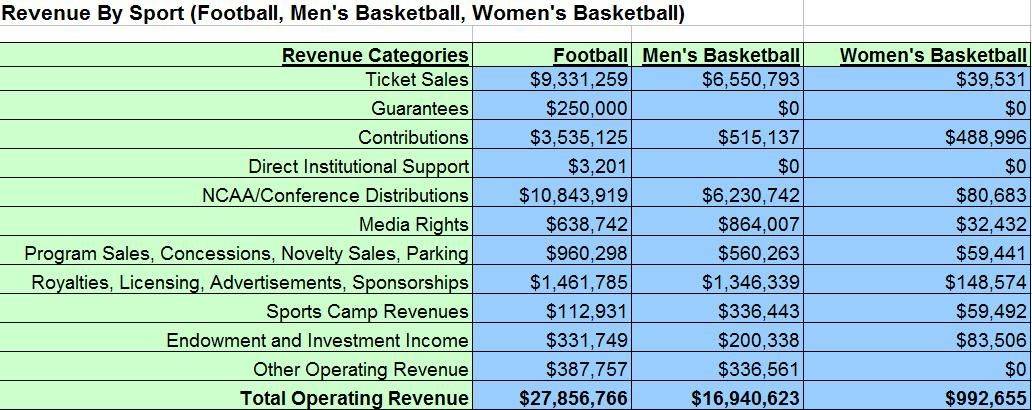
While an exhaustive overview of the revenue streams for each sport is both intensive and unnecessary, it is interesting to note that the revenue streams for the top two revenue-producing sports (football and basketball) was much different than for the rest of the sports programs. Both football and men’s basketball received a great deal of money in 2013 from ticket sales, NCAA/Conference distributions, and royalties, licensing, advertisements, and sponsorships. In addition, football received $3.5 million in general contributions, while men’s basketball received only half a million dollars for the same category.
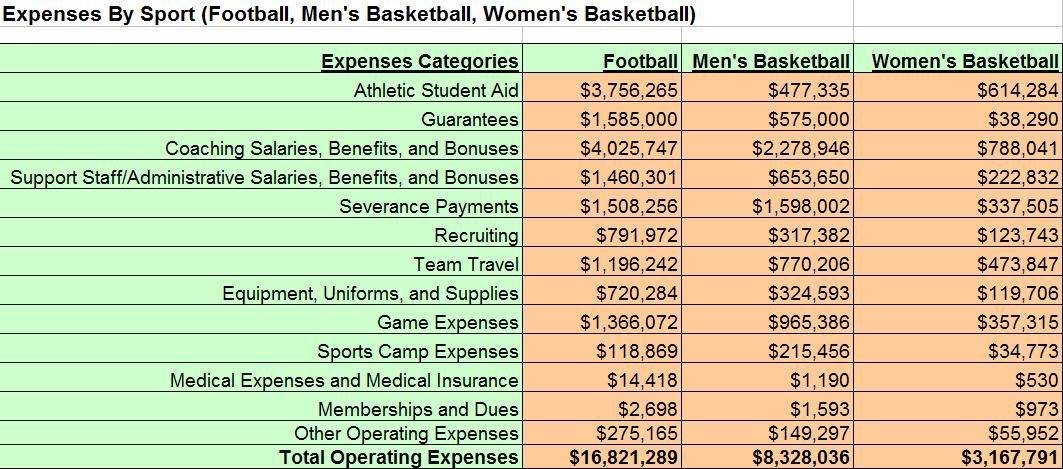
Expenses for the football and basketball programs were higher than the rest of the other individual sports programs, though not nearly as high as the revenue they brought in. The highest categories of expenses for the football program were coaching salaries, benefits, and bonuses; athletic student aid, and guarantees. For the men’s basketball program, the highest category of expenses was coaching salaries, benefits, and bonuses.
Both the football and men’s basketball program paid over $1.5 million in severance payments for the 2013 reporting year.
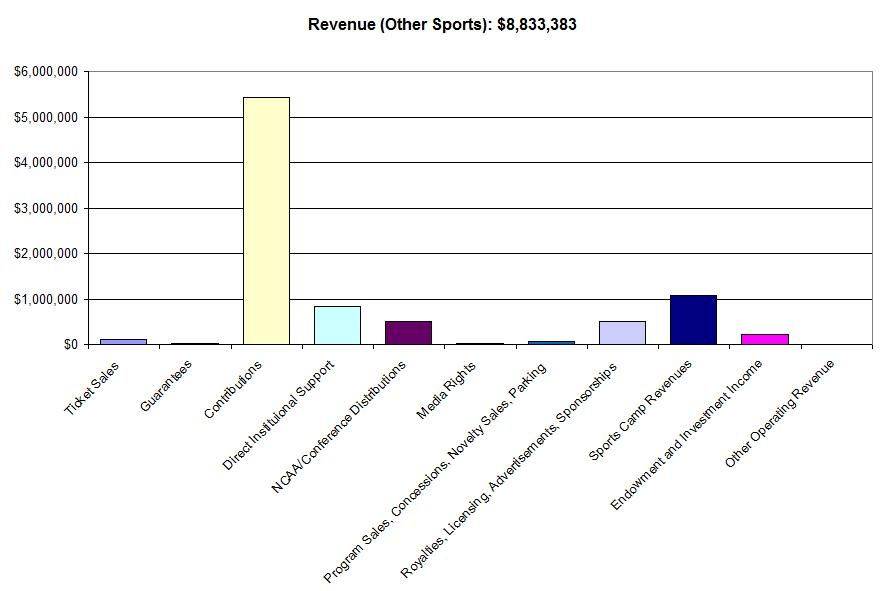
Total revenue brought in by sports other than football and basketball came to nearly $9 million, with contributions bringing in $5.4 million. After that, only “sports camp revenues” brings in over $1 million those sports.
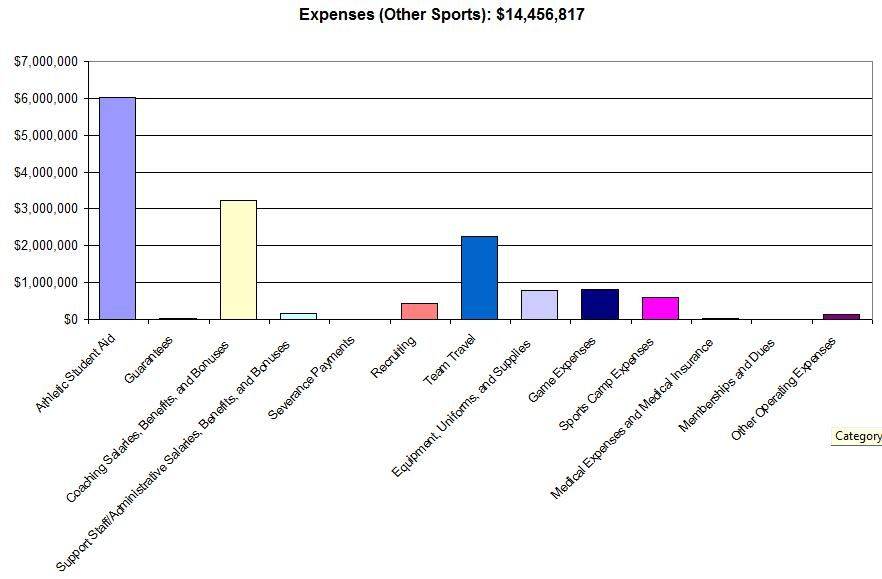
For sports other than football and basketball, expenses were focused on athletic student aid ($6 million), coaching salaries, benefits, and bonuses ($3.2 million), and team travel ($2.2 million). This from a total expense amount of $14.4 million in 2013.
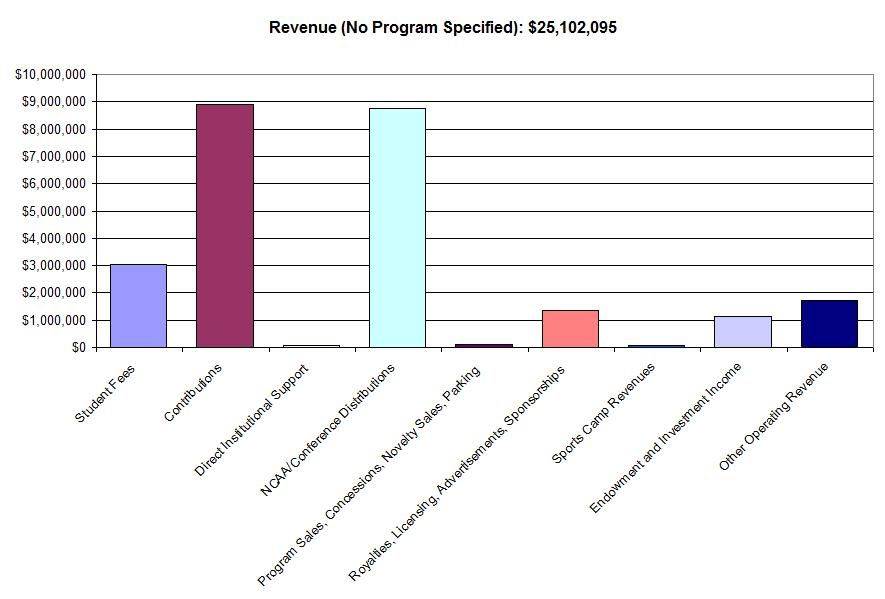
Finally, we come to revenue that was not specified for any particular sports program. Here, the total revenue makes up nearly a third of all revenue and comes from contributions, NCAA/Conference distributions, and student fees.
From the report, student fees are fees “assessed and restricted for support of intercollegiate athletics.” No detail was given after that.
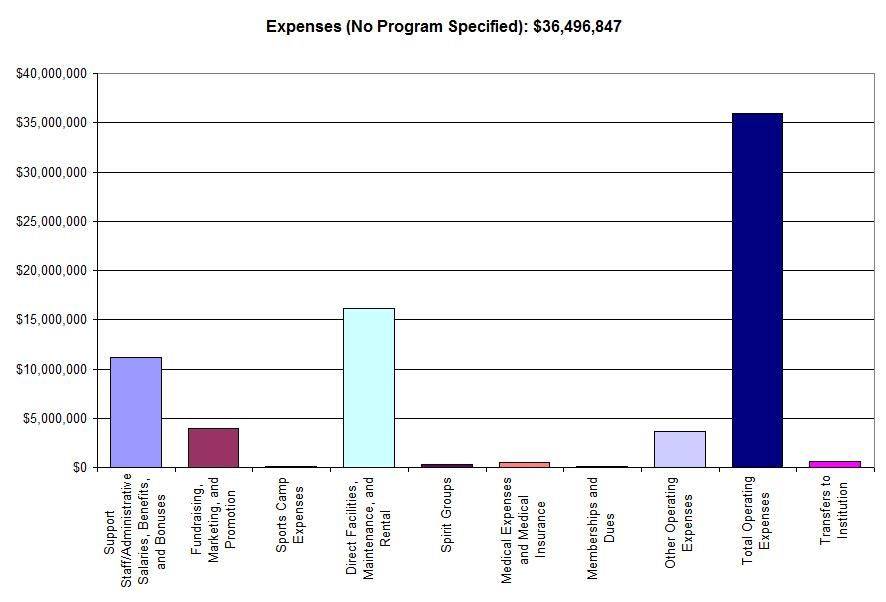
Total expenses (no program specified) amounted to $36.5 million in 2013. The bulk of that came from two categories: Direct facilities, maintenance, and rental ($16 million) and support staff/administrative salaries, benefits, and bonuses ($11 million).
Other subcategories included fundraising, marketing, and promotion, as well as medical expenses and spirit groups (bands, cheerleaders, etc.).